LAST UPDATED: 3/1/2014, 9:30 PM
Last week the Washington Post published a column by Charles Krauthammer expressing skepticism of global warming. In and of itself, the column is unremarkable. Global warming skeptics get their views published all the time. What’s interesting about this particular columnn is that 110,000 people ‘petitioned’ the Post (i.e., they tweeted under the hashtag #Don’tPublishLies) not to publish it. Some regard this as attempted censorship. I say the old dictum applies, “People are entitled to their own opinion. They are not entitled to their own facts.” That’s the problem with the column. It contains a lot of BS. Requesting that a BS-filled column not be published isn’t censorship. It’s demanding responsible journalism. It would be easy enough to let the column go just because there are thousands of others like it but, since 110,000 people took a few seconds to register their disgust, let’s treat it as an exemplar and give it a beat down. Jeffrey Kluger critiques the column in question here. (And Lindsay Abrams does so here, Debunking Charles Krauthammer’s climate lies: A drinking game.) I address three aspects of Krauthammer’s BS below:
- Statements re deterministic predictions of climate models: His lead paragraph, which sets the tone for the column, centers on a rhetorical question which, in terms of framing a debate, is somewhere between a straw man and a non-sequitor. I address the nature of model predictions including uncertainties in inputs which lead to uncertainties in outputs and uncertainties in forecasts even if we knew exactly what the inputs were going to be.
- Namechecking a famous physicist/mathematician to legitimize his skepticism of climate models: The man he namechecks, Freeman Dyson, has a long and well-documented history of making ridiculous and demonstrably false claims re climate science. I address some of that history. Namechecking Dyson undermines Krauthammer’s credibility rather than enhancing it.
- Citing specific data as indicative of a flaw in models used to make global temperature forecasts: Krauthammer neglects to mention that the data in question has been analyzed in detail. The analyses 1) provide a quantitative explanation for the observations and 2) do not suggest that the observations in question are indicative of any fundamental flaws in the climate models used make global temperature forecasts.
Section 1. Statements re deterministic predictions of climate models
Krauthammer leads off:
I repeat: I’m not a global warming believer. I’m not a global warming denier. I’ve long believed that it cannot be good for humanity to be spewing tons of carbon dioxide into the atmosphere. I also believe that those scientists who pretend to know exactly what this will cause in 20, 30 or 50 years are white-coated propagandists.
Name me the scientists who are “global warming believers” who claim to know exactly what effects global warming will induce in 20-50 years. Name me the scientists who’ve made deterministic predictions for how things will turn out. Go ahead and try. There aren’t any. What you get from people who know enough to make plausible predictions is that the land surface temperature (as well as the ocean temperature) is likely to increase significantly – we’re about to blow past the highest average surface temperature experienced over all of agricultural history as well as all of human history – and that it’s hard to imagine the effect of such increases playing out well.
No one is claiming to know exactly what’s going to happen next year let alone 20, 30, or 50 years from now. No one. Given a few days more to think about it, Krauthammer’s statement about “those scientists who pretend to know” isn’t just lacking a basis in reality I also find it leading in a sinister way. It’s easy enough to establish that no scientists are making deterministic predictions for what will happen 20-50 years from now. Is Krauthammer trying to plant the seed, “Well, if they don’t know exactly what’s going to happen then those pointy-headed scientist don’t know anything! They’re no better than weather forecasters!” I suspect so. To cut that argument off at the pass, there’s a huge middle ground between deterministic predictions, i.e., knowing exactly what’s going to happen N years from now, and making semi-educated (or uneducated) guesses about what’s going to happen. Climate forecasts reside in that middle ground. Climate models are not deterministic but, as you’ll see below if you read on, they’re accurate enough that we’d be damn fools not to take them seriously.
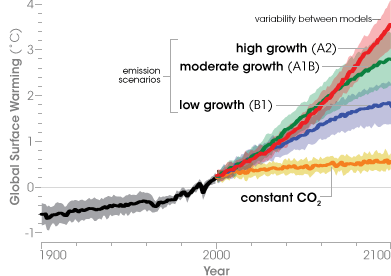
Climate scientists not only make predictions and they go to great lengths to understand the uncertainties associated with their predictions. Let’s take a look at some of those. The Intergovernmental Panel on Climate Change’s (IPCC’s) website is an excellent resource for learning about climate forecasts and general characteristics of climate models. For the sake learning something about forecasts and associated uncertainties, here’s a chart from 2007 showing predicted mean surface temperature vs time for four different emissions scenarios designed “A2” (characteristic of high growth/consumption of resources), “A1B” (characteristic of moderate growth), “B1” (low growth), and “constant CO2” where the atmospheric CO2 concentration remains stable at year 2000 levels. We’ll look at the different forecasts for each scenario first and then get to the uncertainties.
Figure 1. Solid lines are multi-model global averages of surface warming (relative to 1980–1999) for the scenarios A2, A1B and B1, shown as continuations of the 20th century simulations. Shading denotes the ±1 standard deviation range of individual model annual averages. The orange line is for the experiment where concentrations were held constant at year 2000 values.
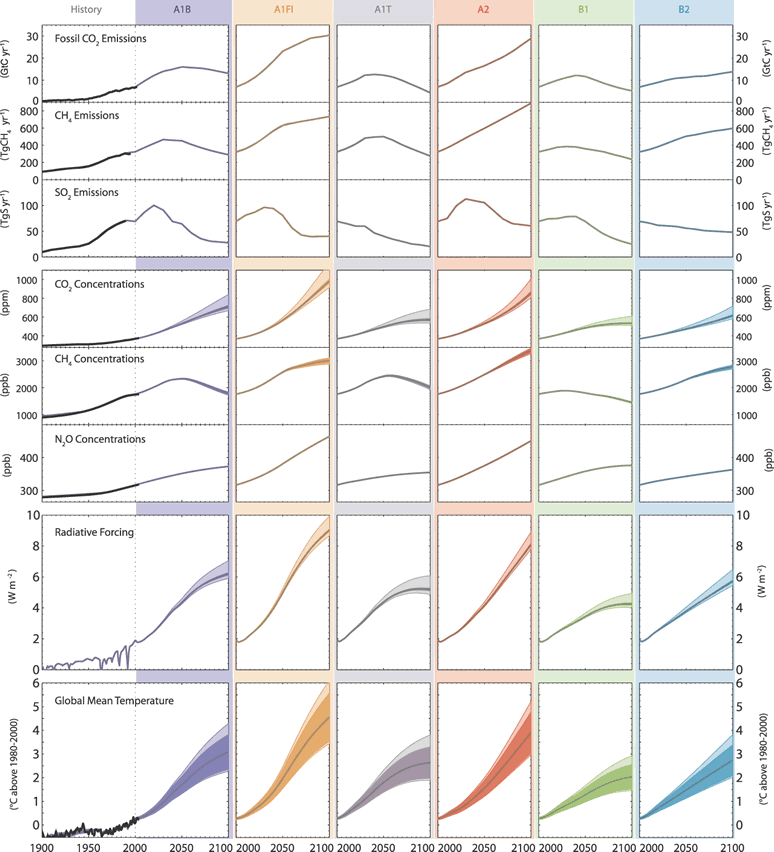
Each of those scenarios corresponds to very different emissions profiles for CO2, methane (CH4), sulfur dioxide (SO2), and nitrous oxide (N2O, a smog precursor). You can see the emissions profiles associated with the A2, A1B, and B1 scenarios – as well as those for a few other scenarios – in the figure below.
Figure 2. Emissions profiles for CO2, methane (CH4), sulfur dioxide (SO2), and nitrous oxide (N2O) and associated radiative forcing and mean global surface temperature for B1, A1T, B2, A1B, A2, and A1FI scenarios. (More detail on the emissions scenarios here or just visit the IPCC website and explore a bit.)
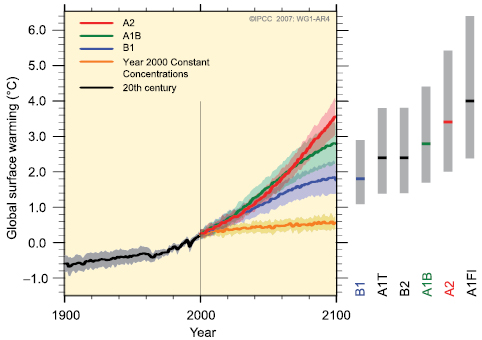
Atmospheric CO2 concentration is currently about 400 parts-per-million (ppmv). The A1B scenario has it reaching about 700 ppmv in 2100, A2 puts it over 800 ppmv by 2100, and B1 puts it around 550ish ppmv. (Sorry, my eyesight isn’t good enough to pick the exact numbers off the chart.) Those are all substantial increases above present day concentrations and, accordingly, there’s a lot of variation in the surface temperature forecast. So where exactly does Krauthammer come up with his “scientist who pretend to know exactly what this will cause” bit? Yes, there’s uncertainty in what the actual emissions profiles will be but, given a particular emissions profile, the uncertainty in the predicted increase is significantly less than the predicted increase. Here’s a chart with a little more detail on the temperature forecasts:
Figure 3. Same as Figure 1 but with additional detail. The grey bars at right indicate the best estimate (solid line within each bar) and the likely range assessed for the six SRES marker scenarios (95% confidence interval).
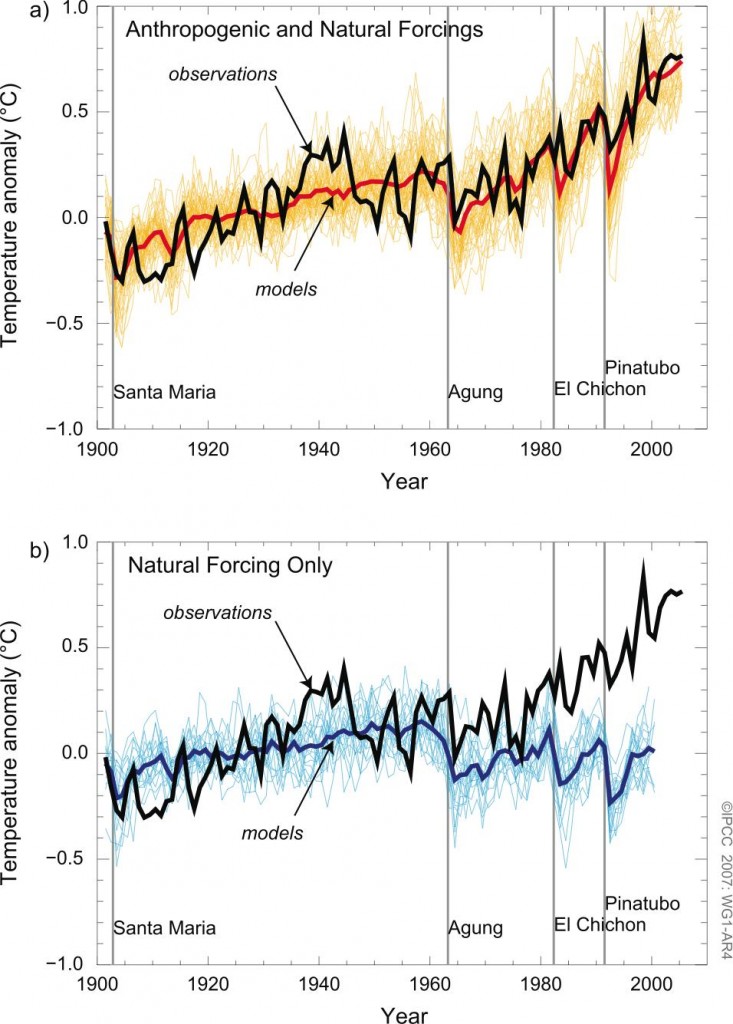
The gray error bars on the righthand side of the chart show the 95% confidence intervals for the year 2100 surface temperature anomaly associated with each emissions profile shown in Figure 2. (The forecasts in Figs. 1 & 3 are from 2007. If you’d like more recent forecasts then look here. The numbers are basically the same.) By wait, you say, those are forecasts. Should we be confident in the forecasts? Glad you asked. The figure below show the results you run the model used to generate the forecasts above in reverse from 2000 back to 1900.
Figure 4. Temperature observed and hindcast surface temperature anomalies. Hindcasts made with (top graph) and without (bottom graph) anthropogenic forcings.
Compare and contrast the results with and without anthropogenic forcings. The model runs which incorporate anthropogenic forcings matches observations much better than the one which incorporates natural forcings only. I say there are two takeaways from Figure 4: 1) Anthropogenic forcing makes a difference and 2) The quantitative prediction of the model which incorporates anthropogenic forcing is very good over the 1.0ish deg C temperature rise between 1900 and 2000. Re takehome #2, I wonder how much we can reasonably extrapolate (2 deg C, 3 deg C, 5 deg C?) but based on ability to account for the observed change since 1900 I’m inclined to believe at least the next 1 deg C prediction associated with the emissions scenarios considered.
Figures 1-4, you know where I got ’em? I googled “global warming predictions” and then “global warming emissions scenarios” and looked at the images that came up. Hard work I tell ya. So where exactly does Krauthammer come up with his “scientist who pretend to know exactly what this will cause” bit? Is he too lazy to use Google? Because if he’d bothered to do so he see that his statement isn’t reality-based. Is he lazy or is he a lying sack of shit who figures no one will care enough to check his statement? I say the smart money is on #2.
Section 2. Krauthammer namechecks a buffoon in a effort to gain credibility.
Krauthammer:
“The debate is settled,” asserted propagandist in chief Barack Obama in his latest State of the Union address. “Climate change is a fact.” Really? There is nothing more anti-scientific than the very idea that science is settled, static, impervious to challenge. Take a non-climate example. It was long assumed that mammograms help reduce breast cancer deaths. This fact was so settled that Obamacare requires every insurance plan to offer mammograms (for free, no less) or be subject to termination.
Now we learn from a massive randomized study — 90,000 women followed for 25 years — that mammograms may have no effect on breast cancer deaths. Indeed, one out of five of those diagnosed by mammogram receives unnecessary radiation, chemo or surgery.
Nicely played false equivalence. We’ll give Chuck +2 for that. Out of curiosity though, where does Chuck stand on conservation of energy? Settled science? Not settled?
So much for settledness. And climate is less well understood than breast cancer. If climate science is settled, why do its predictions keep changing? And how is it that the great physicist Freeman Dyson, who did some climate research in the late 1970s, thinks today’s climate-change Cassandras are hopelessly mistaken?
Well, Chuck, that would be because Mr. Dyson has shit for brains when it comes to understanding climate science.
Dyson is a particular disgusting example of someone who exploits his legitimately established credibility in one field to influence discussion in another field in which he has no expertise. (Edward Teller is another physicist who did it.) Calling Dyson willfully ignorant of basic science would be far too kind. Here are a couple links which document his BS:
- RealClimate.org, The Starship vs. Spaceship Earth
- RealClimate.org, Freeman Dyson’s Selective Vision
From The Starship vs. Spaceship Earth:
“The problem is that Dyson says demonstrably wrong things about global warming, and doesn’t seem to care so long as they support his notion of human destiny… The examples of this are legion. In the essay “Heretical thoughts about science and society” Dyson says that CO2 only acts to make cold places (like the arctic) warmer and doesn’t make hot places hotter, because only cold places are dry enough for CO2 to compete with water vapor opacity. But in jumping to this conclusion, he has neglected to take into account that even in the hot tropics, the air aloft is cold and dry, so CO2 nonetheless exerts a potent warming effect there. Dyson has fallen into the same saturation fallacy that bedeviled Ångström a century earlier. [CG: The “saturation fallacy” is addressed here and here.] And then there are those carbon-eating trees… He points out that the annual fossil fuel emissions of carbon correspond to a hundredth of an inch of extra biomass per year over half the Earth’s surface, and suggests that it shouldn’t be hard to tweak the biosphere in such a way as to sequester all the fossil fuel carbon we want to in this way. Dyson could well ask himself why we don’t have kilometers-thick layers of organic carbon right now at the surface, resulting from a few billion years of outgassing of volcanic CO2.
Yes, riddle me that, Mr. Dyson. Why the fuck aren’t we standing are a few thousand feet of topsoil? Hmmm… That’s a real headscratcher…
The answer is that bacteria have had about two billion years to evolve so as to get very, very good at combining any available organic carbon with oxygen. It is in fact extremely hard to put organic carbon in a form or place where it doesn’t get oxidized back into CO2 (Mother Nature thought she had done that trick with fossil fuels but we sure fooled her!) And if you did somehow coopt ten to twenty percent of the worldwide biosphere’s photosynthetic capacity to take up carbon and turn it into a form that couldn’t rot ever, you’d have to sort of worry about how nutrients would ever get back into the ecosystem.”
Dyson’s CO2/H2O confusion is sad. His carbon-eating trees bit is hilarious. Really, how can you not love that? One wonders how it would work? Shrubs that piss oil and trees that shit diamonds? I hang my head in shame at my lack of creativity. And the lack of topsoil? That never occurred to him? Wow. The bottom line on Dyson should be this: Outside of his statements re quantum electrodynamics and abstract mathematics do not take the man seriously.
Section 3. Krauthammer cites specific data as indicative of a flaw in models when in fact analysis of said data does not show any such thing
Krauthammer:
Even Britain’s national weather service concedes there’s been no change [in global surface temperature] — delicately called a “pause” — in global temperature in 15 years. If even the raw data is recalcitrant, let alone the assumptions and underlying models, how settled is the science?
Let’s investigate that claim. Over to RealClimate.org, Going with the Wind (emphasis mine):
A new paper in Nature Climate Change out this week by England and others joins a number of other recent papers seeking to understand the climate dynamics that have led to the so-called “slowdown” in global warming. As we and others have pointed out previously (e.g. here), the fact that global average temperatures can deviate for a decade or longer from the long term trend comes as no surprise. Moreover, it’s not even clear that the deviation has been as large as is commonly assumed (as discussed e.g. in the Cowtan and Way study earlier this year), and has little statistical significance in any case. Nevertheless, it’s still interesting, and there is much to be learned about the climate system from studying the details.
Several studies have shown that much of the excess heating of the planet due to the radiative imbalance from ever-increasing greenhouses gases has gone into the ocean, rather than the atmosphere (see e.g. Foster and Rahmstorf and Balmaseda et al.). In their new paper, England et al. show that this increased ocean heat uptake — which has occurred mostly in the tropical Pacific — is associated with an anomalous strengthening of the trade winds. Stronger trade winds push warm surface water towards the west, and bring cold deeper waters to the surface to replace them. This raises the thermocline (boundary between warm surface water and cold deep water), and increases the amount of heat stored in the upper few hundred meters of the ocean. Indeed, this is what happens every time there is a major La Niña event, which is why it is globally cooler during La Niña years. One could think of the last ~15 years or so as a long term “La-Niña-like” anomaly (punctuated, of course, by actual El Niño (like the exceptionally warm years 1998, 2005) and La Niña events (like the relatively cool 2011).
A very consistent understanding is thus emerging of the coupled ocean and atmosphere dynamics that have caused the recent decadal-scale departure from the longer-term global warming trend. That understanding suggests that the “slowdown” in warming is unlikely to continue, as England explains in his guest post, below. –Eric Steig
Krauthammer then goes on to mention tornadoes and hurricanes whose intensity may or may not have anything to do with climate change and then states:
None of [these things are] dispositive. [They don’t] settle the issue. But that’s the point. It mocks the very notion of settled science, which is nothing but a crude attempt to silence critics and delegitimize debate. As does the term “denier” — an echo of Holocaust denial, contemptibly suggesting the malevolent rejection of an established historical truth.
He’s correct. The science isn’t 100% settled. Predictions will inevitably change as scientists gather more data and refine working climate models. Yes, there’s uncertainty in radiative forcing due to aerosols and cloud physics (more on that below) but even if reality turns out on the favorable end of the uncertainty estimates odds are still high that the climate will warm. And here’s one for those who don’t think the climate is changing or expect it change: What is your General Circulation Model telling you? What are the inputs and assumptions that generate results which lead you to conclude that the climate will remain more or less as is? What, your assertion that climate change claims are bogus isn’t based on a positive prediction that things are unlikely to change? What’s that you say? You don’t even have any physics-based climate models? Oh, sorry, pardon me for asking.
The issue isn’t whether it’s 100% certain that the climate will warm but what are the plausible outcomes if it does warm. Is a 1% risk of extinction sufficient motivation for us change our behavior? How about 5%? 10%? 50%? Here’s the thing Chuck, dumping CO2 into the atmosphere at the rate we are is like playing Russian roulette. Maybe we blow our brains out, maybe we don’t. You can calculate your odds but the bigger question is (or at least should be), “Why the hell would you choose to play Russian roulette in the first place?” That Russian roulette analogy is flawed though. Even in the worst case scenario people reading this post will likely be dead of old age before any climate-change-induced-shit hits the fan. A more apt analogy is “Would you force your kids or grandkids to play Russian roulette?”
Appendix A. Something else to keep you awake at night
The details of climate forecasts depend on some unresolved cloud physics. Long story short: High (cirrus) clouds warm the planet – they prevent heat from escaping – but low clouds have a cooling effect – they reflect solar radiation and reduce heating. As the Earth warms the atmosphere becomes more humid. Whether the increased humidity favors warming or cooling depends upon whether we get more high clouds or more low clouds. More low clouds good; fewer low clouds bad. With that in mind, here’s a press release summarizing finding by atmospheric scientist Steve Sherwood and colleagues (emphasis mine):
Global average temperatures will rise at least 4°C by 2100 and potentially more than 8°C by 2200 if carbon dioxide emissions are not reduced according to new research published in Nature. Scientists found global climate is more sensitive to carbon dioxide than most previous estimates.
The research also appears to solve one of the great unknowns of climate sensitivity, the role of cloud formation and whether this will have a positive or negative effect on global warming.
“Our research has shown climate models indicating a low temperature response to a doubling of carbon dioxide from preindustrial times are not reproducing the correct processes that lead to cloud formation,” said lead author from the University of New South Wales’ Centre of Excellence for Climate System Science Prof Steven Sherwood.
“When the processes are correct in the climate models the level of climate sensitivity is far higher. Previously, estimates of the sensitivity of global temperature to a doubling of carbon dioxide ranged from 1.5°C to 5°C. This new research takes away the lower end of climate sensitivity estimates, meaning that global average temperatures will increase by 3°C to 5°C with a doubling of carbon dioxide.”
The key to this narrower but much higher estimate can be found in the real world observations around the role of water vapour in cloud formation.
Observations show when water vapour is taken up by the atmosphere through evaporation, the updraughts can either rise to 15 km to form clouds that produce heavy rains or rise just a few kilometres before returning to the surface without forming rain clouds.
When updraughts rise only a few kilometres they reduce total cloud cover because they pull more vapour away from the higher cloud forming regions.
However water vapour is not pulled away from cloud forming regions when only deep 15km updraughts are present.
The researchers found climate models that show a low global temperature response to carbon dioxide do not include enough of this lower-level water vapour process. Instead they simulate nearly all updraughts as rising to 15 km and forming clouds.
When only the deeper updraughts are present in climate models, more clouds form and there is an increased reflection of sunlight. Consequently the global climate in these models becomes less sensitive in its response to atmospheric carbon dioxide.
However, real world observations show this behaviour is wrong.
When the processes in climate models are corrected to match the observations in the real world, the models produce cycles that take water vapour to a wider range of heights in the atmosphere, causing fewer clouds to form as the climate warms.
This increases the amount of sunlight and heat entering the atmosphere and, as a result, increases the sensitivity of our climate to carbon dioxide or any other perturbation.
The result is that when water vapour processes are correctly represented, the sensitivity of the climate to a doubling of carbon dioxide – which will occur in the next 50 years – means we can expect a temperature increase of at least 4°C by 2100.
“Climate sceptics like to criticize climate models for getting things wrong, and we are the first to admit they are not perfect, but what we are finding is that the mistakes are being made by those models which predict less warming, not those that predict more,” said Prof. Sherwood.
“Rises in global average temperatures of this magnitude will have profound impacts on the world and the economies of many countries if we don’t urgently start to curb our emissions.
Maybe Sherwood and co have it right. Maybe their revised model is overly pessimistic. How much are you willing to bet on him being wrong?


