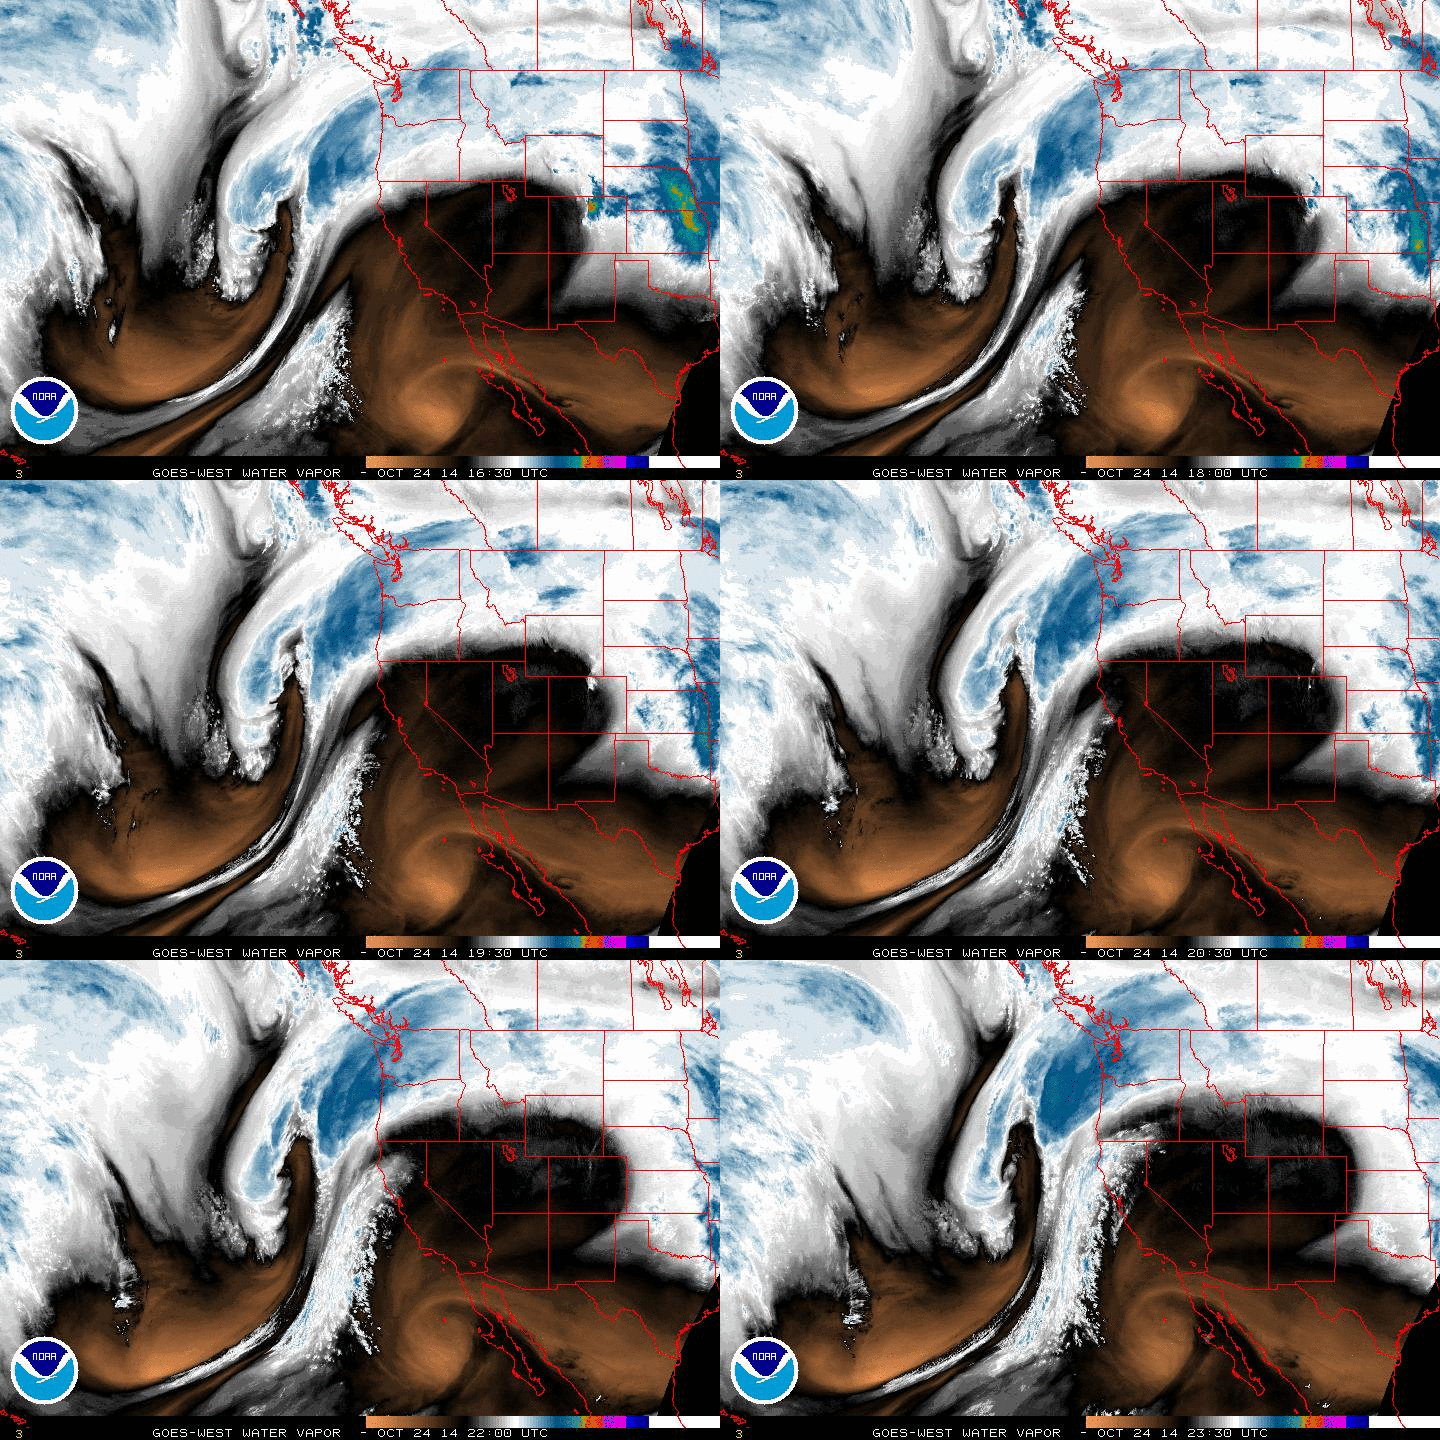
I saw the animation below on California Weather Blog. It’s produced by NOAA from GOES West imagery to illustrate atmospheric circulation of water vapor. What caught my eye about this particular loop is the continental-scale evolution of the circulation.
NOAA’s description of the color scale:
[Water vapor images are] taken using a wavelength sensitive to the content of water vapor in the atmosphere. Bright and colored areas indicate high water vapor (moisture) content (colored and white areas indicate the presence of both high moisture content and/or ice crystals). Black and brown areas indicate little or no moisture present. Water vapor imagery is useful for both determining locations of moisture and atmospheric circulations.
GOES West loops available here.

