
US personal saving rate since 1959:
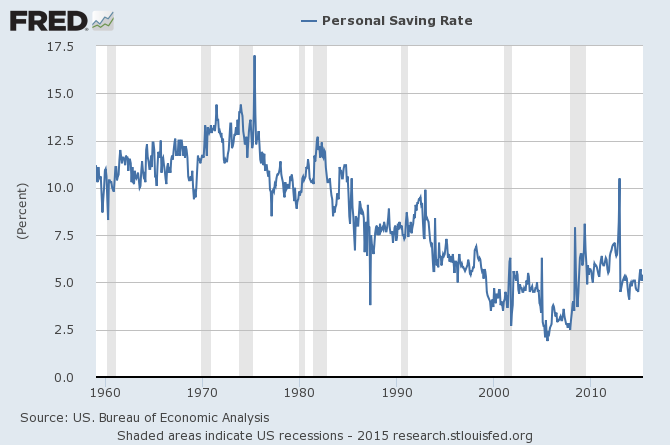
It declined from about 1975 until 2008, i.e., the start of The Great Recession. There’s been a modest uptick since then but it’s still only about 40% of it’s peak. (I’m ignoring that brief spike to 17% ca 1975.) Now compare that with plots of worker productivity and compensation since 1949: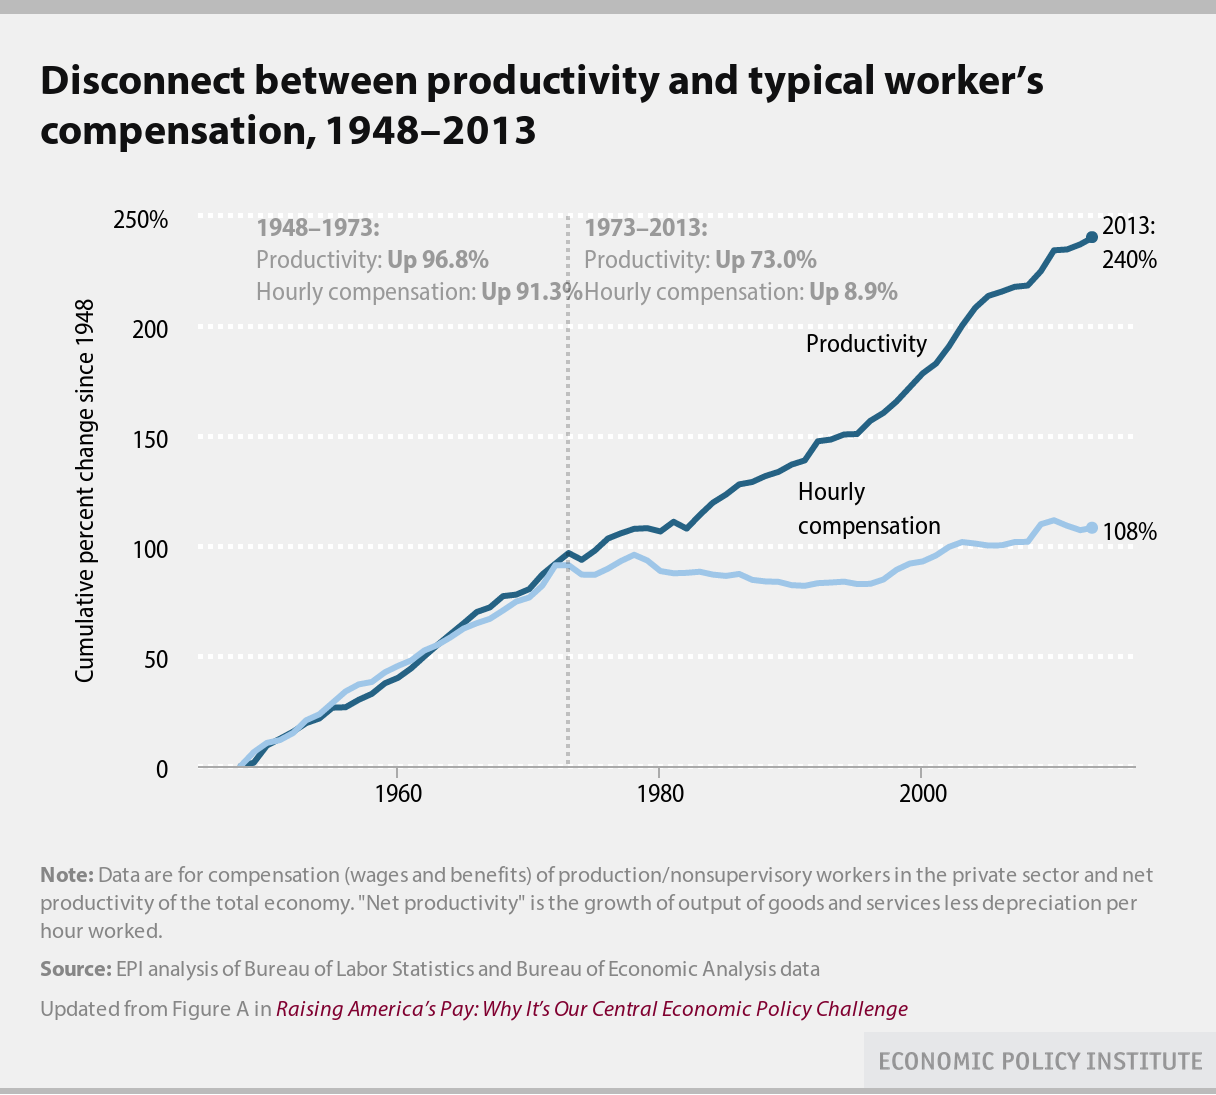
(Source) Perhaps it’s coincidental by but the break in productivity and compensation occurs at near the same time as the decline in savings rate began. Eyeballing the charts the productivity-compensation break occurred a little before the start of the saving rate decline. I’m not sure what to make of that. (My knowledge of economic history isn’t good.) I’m curious if anyone has a Big Picture explanation which ties the two together though, e.g., specific legislation which enabled the productivity-compensation break? That compensation stayed flat might have motivated people to “tighten their belts” in order to maintain their prior saving rate. Why didn’t it? (Consumer culture is relentless in urging us spend. Did the messages to spend start winning the day ca. 1975?)