If you do much exploratory data analysis you’re likely aware of two papers published back-to-back in Science in 2000 – one which introduced Isometric Feature Mapping (Isomap) and the other which introduced Locally Linear Embedding (LLE). If you’re not familiar with them, both papers describe methods for creating low-dimensional representations of high-dimensional data AND are able to learn the global structure of nonlinear manifolds. It’s that latter capability which makes them noteworthy. To wit, according to Google Scholar they’ve each been cited over 5,500 times! Continue reading
Category Archives: Math and Statistics
Four very useful papers
Perhaps it’s an overstatement to call the following four papers “classics” but I believe they’ll withstand the test of time. I wouldn’t be surprised if people cite them as primary sources 100 years from now.
Pretty much everyone who has analyzed data has had occasion to use linear regression analysis. For analysis of multivariate data, if the signal sources aren’t known beforehand then you’d typically use – or least explore – Principal Components Analysis (PCA) or Singular Value Decomposition (SVD) or maybe Independent Components Analysis (ICA) to identify what to use as regressors/predictor variables. If you have to go that route then you need to have a rational basis for choosing how many regressors (PCs or ICs) are statistically-significant, as you only want to use the statistically-significant ones in your analysis. (If you include too many then you’re fitting noise.) Choosing the number of regressors is an act of model order selection. This paper describes a very sensible basis for choosing model order for a PCA. Their method is general however, not limited to PCA:
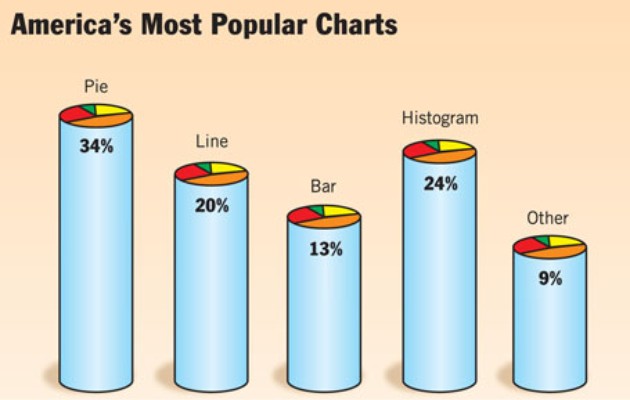
America’s Most Popular Charts
(Courtesy of The Onion. Brought to my attention by Andrew Gelman.)
Your Manuscript…
If you’re going to submit your manuscript to a peer-reviewed journal then please show a little consideration for the reviewers and run it by some colleagues first – people who will give you honest and informed feedback – people who can and will let you know if it needs work before you submit it to a journal.
I just reviewed a manuscript from a journal where… well, when I get a request from them I immediately think, based on past experience, “Oh, god, please let it be a short one.” Continue reading
Words To Live By
Quotes attributed to the late John Tukey:
The combination of some data and an aching desire for an answer does not ensure that a reasonable answer can be extracted from a given body of data.
Far better an approximate answer to the right question, which is often vague, than an exact answer to the wrong question, which can always be made precise.
Those statements, in the context of his body of work, suggest that he was a very modest man.
(I need to find a permanent home for those quotes somewhere on this blog.)
Frequentists vs Bayesians
Evaluating Election Forecasts
Quantitative election forecasters received a lot of attention in the popular press this year. Nate Silver and his “538” blog at the NY Times probably received the most but Sam Wang, Drew Linzer and others also got their fair share. Prior to the election, I only followed Silver and, to a lesser extent, Wang. Both predicted an Obama victory but Wang gave him a much higher probably of victory than did Silver.
Now that the results are in, there’s a fair amount of interest in determining who was most accurate. (See, e.g., here and here.) Silver and Linzer presented their predictions in a manner which makes them easier to evaluate than the others – easier for me at least. (Credit to them for doing so.) A.C. Thomas does a nice compare and contrast here and concludes that Silver’s predictions are higher fidelity, i.e., they’re accurate and, at least as significant, he appears to have the uncertainties associated with his predictions nailed. Thomas was gracious enough to make the data he used in his analysis publicly available here. I worked the numbers and – not surprisingly – saw the same things he did. I also noted a few other things.
First off, the data and how I worked it: Continue reading


