How to analyze data – short version

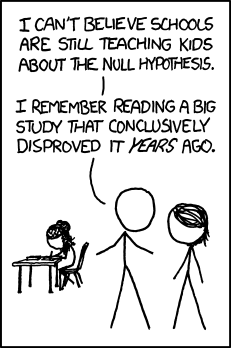
Inspired by a post on Andrew Gelman’s blog, The harm done by tests of signficance:

The first four steps to understanding cause and effect:

  1. Formulate your signal hypotheses,  H_i where i = 1, …, n.
  2. Fit your signal models to your data,  \mathbf{x} .  Obtain model parameter values, \mathbf{\theta}, under each model.
  3. Reality-check your fit results. Does at least one of the fit models do a decent job of fitting the data?  (If p(\mathbf{x}|H_j) is crazy low for all of your signal hypotheses then either you’ve got a highly anomalous observation on your hands or your signal hypotheses do not include the one which gave rise to the data.)
  4. Compute posterior probabilities:

     \begin{equation*} p(H_j|\mathbf{x}) = \frac{p(\mathbf{x}|H_j) \cdot p(H_j)} { \sum_{i=1}^{n} p(\mathbf{x}|H_i) \cdot p(H_i)} \end{equation*}

Get through those steps and you may have a story to tell. Continue reading

A significance test for LASSO

I list Tibshirani’s paper describing his Least Absolute Shrinkage and Selection Operator (LASSO) method on my Primary Sources page.  Full disclosure:  I’ve never had occasion to use it myself but I’ve seen it used to productive effect.  Sparsity-promoting ridge regression is just a really smart and (in many circumstances) useful concept.   Not too many know about it currently but in 100 years (probably sooner) it will be standard content in stat textbooks.  Because it’s not yet widely known it’s worth calling attention both to the method and to how it’s implemented.  Tibshirani published his original paper in 1996.  The big deal is that he and several colleagues have developed a significance test for predictor variables.  From Andrew Gelman’s blog:

 I received the following email from Rob Tibshirani:

Over the past few months I [Tibshirani] have been consumed with a new piece of work [with Richard Lockhart, Jonathan Taylor, and Ryan Tibshirani] that’s finally done. Here’s the paper, the slides (easier to read), and the R package.

I’m very excited about this. We have discovered a test statistic for the lasso that has a very simple Exp(1) asymptotic distribution, accounting for the adaptive fitting. In a sense, it’s the natural analogue of the drop in RSS chi-squared (or F) statistic for adaptive regression!

It also could help bring the lasso into the mainstream. It shows how a basic adaptive (frequentist) inference—difficult to do in standard least squares regression, falls out naturally in the lasso paradigm.

This is a big deal.  If you do regression analyses in your work then check it out.  (If you’re not familiar with ridge regression, a.k.a. regularized regression, then best to check that out first.)

Understanding p-values

[UPDATE 3/16/2013:  I’ve revised this post multiple times over the past ~12 hours and will likely continue to do so over the next few days.]

There’s a lively discussion over at Andrew Gelman’s blog following his post, Misunderstanding the p-value.  (No, it has nothing to do with urine tests.)  The Wikipedia definition is actually spot on:  “In statistical hypothesis testing the p-value is the probability of obtaining a test statistic at least as extreme as the one that was actually observed, assuming that the null hypothesis is true.”   The way to describe it formally (and a poster on Gelman’s blog did) is  p(t>T|H_0) , where t is the calculated test statistic, T is the user-specified critical value of the test statistic, and  p(x|H_0) means  x conditional on the null hypothesis,  H_0 , being true.  (If you fed your detector a continuous stream of data where  H_0 was true then the p-value would be your Type I error rate – or vice versa, depending upon how you prefer to look at it.)

The thing which has made the discussion on Gelman’s blog lively is that not all concur with that definition.  Specifically, some object to calling the p-value a conditional probability.  Continue reading

The Gartner Hype Cycle

hypecycle

NB:  The figure above was originally provided with a post, The Lack of Wisdom of Crowds.

I’ll also note that I’ve been involved with the field of hyperspectral imaging from not long after the technology trigger.  I’d say the field is currently on the Slope of Enlightenment.   (Sorry the ‘hyperspectral imaging’ link isn’t very good.  The Wikipedia entry contains a hefty dose of stealth advertising and I couldn’t find a good academic link which describes the field for non-specialists.  Most sites seems to presume you already know what it is.)

Semantics or substance?

[UPDATE 2/12/2013:  Given a few more weeks to think about it, this post hardly seems worth the electrons.  The example I use to justify usage of “accept H0” doesn’t involve distinct H0 and H1 hypotheses:  H0 = ~H1.  If the only options are A and ~A then, sure, A = ~~A but that’s not exactly a revelation.  The real question is “Is it legitimate to say you “accept H0″ when there are distinct H0 and H1 hypotheses?”  For that case, I believe “reject H1” is appropriate but “accept H0” is not, i.e., I accept conventional usage.  Anyhow, read on if you’re hurting for entertainment.]

Hypothesis testing is a basic problem in statistical analysis.  You consider a null hypothesis (H0) in the context of an alternative hypothesis (H1).  If your experiment is testing for an effect then H0 is ‘no effect’ and H1 is ‘effect is present’.   In statistics parlance, one may “reject H0” or “accept H1” but one never “accepts” H0.  You can “reject H1” but you don’t “accept H0”.  On the one hand, that makes sense.  You could establish with a high degree of confidence that your data isn’t consistent with H1 and therefore reject it but that doesn’t mean that H0 is true.   (H1 could be true and you just happened to collect funky data which led you to reject it.  Type II error.  Oops.)

But on the other hand, maybe it doesn’t make so much sense.  Continue reading

Weekly Digest – January 6, 2013

Fiscal Cliff Deal

I Do Not Understand the Obama Administration, Brad DeLong.

The big reason to make a deal before January 1, 2013 was that detonating the “austerity bomb” would impose 3.5% of fiscal contraction on the U.S. economy in 2013, and send the U.S. into renewed recession. It was worth making a good-enough deal–sensible long-run revenue increases and tax cuts to close the long-run fiscal gap plus enough short-term fiscal stimulus to make the net fiscal impetus +1.0% of GDP–in order to avoid renewed recession.

Continue reading

Weekly Digest – December 23, 2012

Economics:

Neil Irwin, There is no fiscal crisis.  And macroeconomics is not a morality play. (The title says it all.  Read the full article for the details.)

Brad DeLong, Department of “Oh Dear!”: Basic Macro Briefing Weblogging:

I have been complaining strongly about the failure of Republican economists to adequately brief their political principals. It looks like it is sauce-for-the-gander time…

If it is indeed the case that Obama does not understand the basics of the economic situation he is trying to manage, how likely is it that he can make good decisions?

Matthew O’Brien, Everything you need to know about the economy in 2012, in 34 charts.  (A very nice compilation.)

Politics:

Bruce Bartlett, How Democrats Became Liberal Republicans

Continue reading