Inspired by Brad DeLong’s post today about the current state of the labor market…
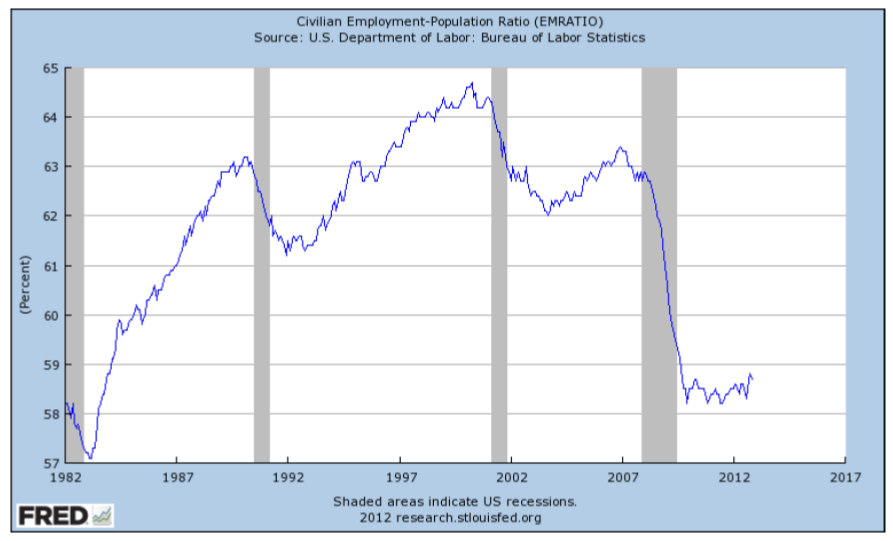
The official unemployment rate is BS. Look at the employment-to-population ratio (EPR) for a better sense of how the economy (and people who need to work for a living) are doing. The data is available via the St.Louis Fed website. Here’s the seasonally-adjusted EPR for people ages 18 to 65 for past thirty years:
It’s basically been rattling along at 58.5% since 2009. That’s down from a peak of about 64.5% around the peak of the dot-com bubble. Excluding the bubble period, maybe 62-63% is more typical of a healthy economy. So what does that mean? I say it means unemployment is about 4% higher than normal, i.e., 62.5% – 58.5%.
PS Brad shows EPR for 25-54 year olds. It’s a more meaningful number than 18-65 I believe but – only looking quickly – I couldn’t find that data on St.Louis Fed website.
PPS The EPR doesn’t take into account demographic changes over time, i.e., fraction of population in the sample age X. IIRC, when you normalize the data to account for demographic changes it’s actually been improving a little over the past couple years – nothing to get excited about but definitely could be much worse.

