
Like 55% of the population, our family has employment-based health insurance. The open enrollment period for 2014 ended a couple weeks ago. We had the option of continuing with the “traditional” plan we had this year or changing to one of three “High Deductible Health Plans” (HDHP). Ordinarily we would have simply continued on with the plan we had but the premium on the traditional plan is going up by $150/month next so we evaluated our other options. Summary characteristics of our current plan and the plans offered for 2014:
| Monthly | Annual | ||||||
| Year | Plan ID | premium | Premium | Deductible | Max o.o.p. | Worst Case | |
| 2013 | Health Plan | $327 | $3,920 | $1,500 | $5,000 | $10,420 | |
| 2014 | Health Plan | $477 | $5,724 | $1,650 | $3,800 | $11,174 | |
| 2014 | HDHP Option 1 | $394 | $4,728 | $2,800 | $3,700 | $11,228 | |
| 2014 | HDHP Option 2 | $235 | $2,820 | $4,500 | $5,250 | $12,570 | |
| 2014 | HDHP Option 3 | $84 | $1,008 | $6,250 | $6,450 | $13,708 |
The plans cover the employee, his/her spouse, and all children. The columns show monthly premium, annual premium, the deductible below which you pay 100% of your medical bills (with the exception annual your annual check-up and some other basic services which are covered in part or in full by the plan). Once you hit the deductible then you pay 20% of the bill if you get your services in-network (and 40% if the provider is out-of-network). For in-network you have the 20% co-pay until you hit the “maximum out-of-pocket”, at which point the plan pays 100% of your bills. (NB: If you go out of network then you pay 40% and there is no maximum out of pocket. You get a significant discount but the sky’s the limit in terms of your liability.) The “Worst Case” is the sum of the three columns to the left and is the maximum amount we’d pay for medical care for the year. If you need a heart transplant, spend six months in the ICU after a bad accident, need brain surgery, etc. then you’d probably hit the “Worst Case” number. For just routine doctor visits you probably won’t be out much over the premium payments. “Worst case” is a chunk of change but it’s not so much that it would bankrupt most middle/upper-middle class people in this neck of the woods. And that’s the point, it’s an insurance plan. If it didn’t limit your worst case expenses it wouldn’t be insurance.
(I’ll note again that the table above doesn’t cover all aspects of the plans. There are also deductibles and out-of-pocket maxes for prescription drugs. Cost sharing for out-of-network coverage could also conceivably amount to a lot of money – although we haven’t ever encountered any out-of-network issues. Those are considerations but they’re secondary issues so I’m setting them aside for this discussion.)
With respect to choosing a 2014 plan, each option offers a slightly different risk-reward combination. If we went with the low premium/high deductible plan then we could conceivably save a few grand if we all stayed healthy. Conversely, if we chose the low premium/high deductible plan we’d be out a few grand relative to the high premium/lower deductible plan if any of us has a major illness. Specifically, the maximum difference in “Worst Case” scenarios for the 2014 plans is about $2,500. In contrast, the difference between the highest and lowest premiums is over $4,500. Choose wisely.
In order to get a handle on the trade space, I created a graph of out-of-pocket expense vs bills incurred (presuming services provided by in-network providers) for each of the plans available to us – see below. Looking at the graph, Out-of-Pocket for Bills Incurred = $0 corresponds to premium paid only. The discontinuities in the vicinity out-of-pocket = $7,500 correspond to hitting the plan deductible for the year. As noted above, the plans pay 80% of bills from in-network providers above that. The curves continue with slope of $0.20 out-of-pocket per dollar expense incurred up to max out-of-pocket at which point plan pays 100%. The curves level off at the “Worst Case” value.
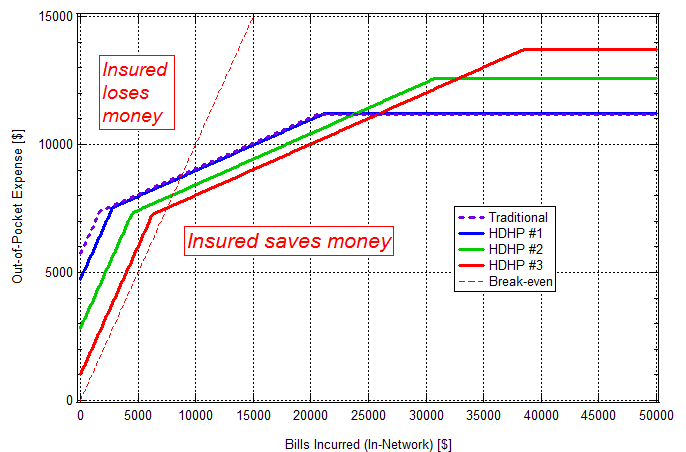
The red dashed line on the graph indicates the break-even level. If you end up above the red dashed line given the plan you picked and the bills you incurred then you lost money by buying insurance. Conversely, if you end up below the line then you saved money.* The break-even point is about $7500 for HDHP #3 (which has the highest max out-of-pocket for the year), about $8000 for HDHP #2, and about $8700 for HDHP #1 and the Traditional plan. Hopefully we don’t end up on the “Insured saves money” side of the line but we buy insurance because hope is not a plan. The curves are representative of how insurance works. Most people who buy in lose money. They buy insurance because of the downside risk of not doing so.
(* Actually, that’s not quite right. Simply having a plan with this insurance company gets you a discount over the nominal price for the services, i.e., the price the insurance company negotiated with the provider. Reviewing our bills for 2013, that amounted to about a 30% discount for us. I should correct the figure above to account for that but right now I’m feeling like it’s not worth the bother.)
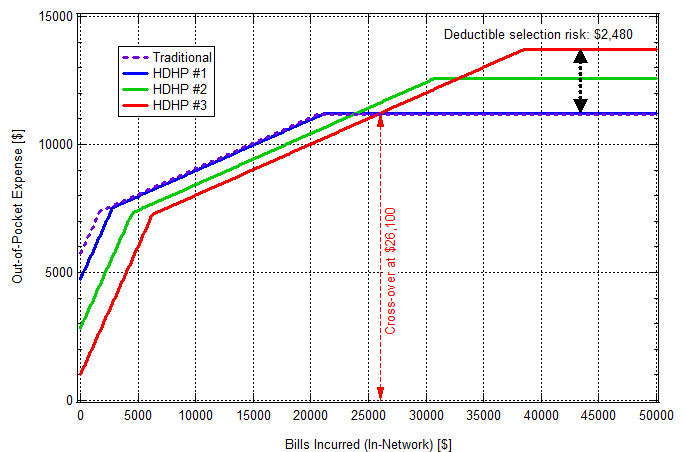
Back to the four curves on the graph and how we decided on our 2014 plan: Looking at the graph you see that the Traditional plan is essentially identical to HDHP #1. That being the case, and also the fact that my employer is hinting that they’ll be ending the Traditional option soon, we decided to switch to an HDHP. But which HDHP? The most cost-effective one depends upon what you expect to incur for expenses. Take #1 and #3 for example. If your bills are low then you could save a few thousand dollars (or more) by choosing #3. However, if you incur a lot of bills for the year, e.g., if you undergo major surgery, then choosing #3 would end up costing you about $2,500 more out-of-pocket than if you choose #1. You hit your max out-of-pocket with #1 once you incur $21,600 in bills. That’s a lot if you’re just in for routine stuff but you could run that up in short order if the shit hit the fan. The crossover point for #1 and #3, i.e., the point at which #3 becomes more expensive than #1, is for $26,100 in bills. The different in worst case values, which I’ll call “Deductible selection risk”, as well as the cross-over point between #1 and #3 are shown in the figure below. I’ll leave it as an exercise to the reader to determine the Deductible Selection Risk for #1 vs #2 and #2 vs #3 as well as the cross-over points for #1 vs #2 and #2 vs #3.
As tempting as it was to run a full Monte Carlo simulation, I restrained myself. I did however go through our bills for this year to see where we were on the x-axis. Based on the total and the presumption that things wouldn’t go horribly wrong healthwise for any of us in 2014 we took our chances and went with HDHP #3. We also opened up a Health Saving Account (HSA). A family can deposit up to $6,550 per year tax free. The HSA looks good not only in that deposits are tax free but that the funds deposited aren’t use-them-or-lose-them. Your HSA rolls over from year to year. When you figure in the tax-free HSA deposits, the HDHPs don’t look so bad. You just need to be able to swing bills up front that the Traditional plan would have covered.
It took me about six hours to review the plans, collect our bills for the year and work up our expenses, then enroll in our selected plan on the company website. (Of those complaining about having their policies cancelled and being offered ones which much higher premiums, what fraction know what their deductible and max out of pocket was and what it would be with the plan being offered. Have they gone through the exercise I did above? It’s a bit of a hassle but it’s not complicated. Everyone should go through the exercise. Everyone, whether they’re pay for their health insurance themselves or not. Not everyone has the luxury of choosing between multiple options but even if you don’t you should understand what you’re covered for and what your potential liabilities are.)
Last thing, I switched jobs about a year ago. My previous employer covered 100% of our premiums and bills not covered by the insurance plan, e.g., bills below the level of the deductible. The only amount we were liable for was a few hundred dollars a year in taxes on the plan value. That was a very sweet deal. The difference between coverage there and our current plan amounts to over $400/month in after-tax income.