
The April Jobs Report came out last week. More of the same: “Unemployment Rate” down but no change the percentage of people who are employed. Binyamin Applebaum with the executive summary:
The American economy continues to add jobs in proportion to population growth. Nothing less, nothing more.
The share of American adults with jobs has barely changed since 2010, hovering between 58.2 percent and 58.7 percent… That is about four percentage points lower than the employment rate before the recession, a difference of roughly 10 million jobs. In other words, the United States economy is not getting any closer to recreating the jobs lost during the recession.
Here’s a chart which shows the employment fraction over the past six years:
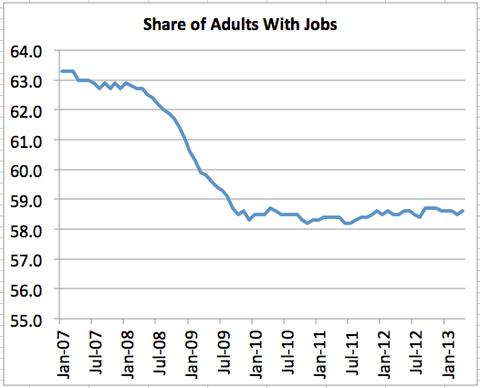
Note that the period when the decline stopped coincided with the peak of ARRA, a.k.a. Stimulus, spending and has been flat since ARRA spending petered out. Make of that what you will.
A few things to note about employment fraction:
- Job openings vs. Unemployment Rate (Things have changed since the Great Recession kicked in.)
- People working part-time when they’d prefer to work full-time. (There are a lot of them.)
- Consequences of long term unemployment (Grim.)
The Beveridge curve: The Beveridge curve is a plot of job openings versus Unemployment Rate. Catherine Rampell had a nice summary and discussion back in March. Here’s the Beveridge curve since 2001:
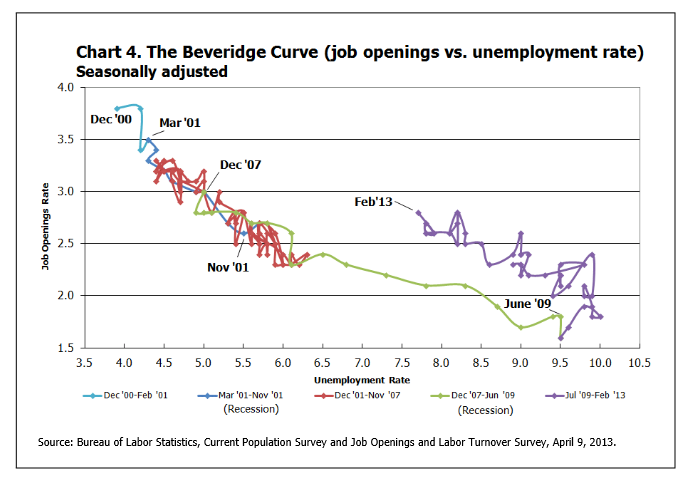
Job vacancy rate is the percentage of unfilled jobs in the (potential) labor force. Unemployment Rate is the official unemployment rate. Ms. Rampell on general characteristics of the Beveridge curve:
In an economic expansion, the jobless rate is low and the job vacancy rate is high; a small share of workers are looking for jobs, and so when employers post a vacancy, the opening can be hard to fill. Or you can think about it the other way — if there are a lot of jobs available, then people will not have much trouble finding work, leading to low unemployment.
In a recession, the reverse is true: there is a high unemployment rate and a low vacancy rate. Where you end up on the curve generally depends on where you are in the business cycle, but you will probably be somewhere on or near that line.
Looking at the graph above you notice that data from Dec. 2000 through mid-2008 follow a pretty tight relationship but that the relationship appears to have changed since 2008. Notice that the unemployment rate is (roughly) back down to what it was four years ago but the job opening rate is now about 30% higher. Ms. Rampell again:
Since late 2009, the curve has shifted outward. That means that even if the job market is not exactly booming, there are more vacancies out there than the unemployment rate alone would have predicted a few years ago.
The million-dollar question is: Why?
There are probably a few forces at work.
One is skills mismatch — that is, the workers who are pounding the pavement do not have the skills that employers actually want.
I think that’s a bit off. I suspect that A) people who have desired skills aren’t willing to leave their jobs for the wages and benefits being offered by the companies who’d like to hire them and B) employers aren’t willing to invest in training because they fear competitors will offer better salaries and hire the recent trainees away. I’ll speculate further that the hesitation to pay higher salaries and make investments in training is in part because the economy is rather sickly, i.e., under current conditions it’s easy to be skeptical that new investment will increase revenue and profits to the extent that the investment expense will be covered.
Related to Item A above, don’t underestimate the lengths some corporations will go to to drive down wages. I’m thinking in particular of the efforts of high tech execs to get the H1-B visa cap lifted. As I posted a few months ago, the H1-B program is – in general – a good thing but, if you’re a US citizen who works for living, then lifting the H1-B visa cap is not. (See here for an overview of the Immigration bill.)
Anyhow, back to Ms. Rampell again for suggestions on why the job vacancy rate is higher now than it was four years ago even though the unemployment rate is about the same:
In addition, there are now a lot of long-term unemployed workers whose skills may have deteriorated. Maybe some are not currently fit for any job, even in the industry or occupation in which they last worked. Or maybe employers just assume this, keeping the long-term unemployed stuck that way no matter what they do…
Another explanation may have to do with whether all those who are calling themselves unemployed today would have been counted as unemployed in the past. In recent years, jobless-benefit eligibility has been longer than at any previous time in American history, with some workers qualifying for as long as 99 weeks. That longer duration of benefits could be inflating the unemployment rate…
Finally, we get to the explanation I focused on in the front-page article: that employers have vacancies but are afraid to fill them because of economic and policy uncertainty.
Maybe sales growth will drop off, they worry…
All food for thought. There’s also this.
Changing gears a little, in the same issue of the Times as Applebaum’s piece, Jared Bernstein asks “Where have all the good jobs gone?“:
Though yesterday’s employment report revealed a slowly improving job market, the jobless rate is still elevated, at 7.5 percent, with 11.7 million people looking for work, including 4.4 million who have been doing so for at least half a year. About eight million more were stuck in underemployment (“involuntary” part-timers) last month, unable to find the hours of work they sought.
These measures persist amid an economic expansion continuing since mid-2009, a roaring stock market and a housing market that’s now reliably in recovery.
While the high jobless numbers are partly a legacy of the Great Recession, the fact is that our economy has generated too few jobs for most of the last 30 years and is likely to continue to do so…
For decades in postwar America, the maintenance of full employment, defined as an unemployment rate below 5 percent, was enshrined in law, beginning with the Employment Act of 1946 and revisited in 1978 in the Humphrey-Hawkins Act… And it usually worked… between 1949 and 1979 the market was at full employment over two-thirds of the time. Since then, it has been at that level just a third of the time.
How did this happen? Both the politics and economics are implicated…
One explanation may be that capital investment has become, to put it politely, more “labor saving.” Yes, this process has been going on forever, but robotics and other ways of automating tasks may be accelerating it.
Second, our large and persistent trade deficits have exported too much demand…
Third, a growing number of economists believe that our very high levels of inequality are not just whacking the incomes of the “have-nots” but are slowing job growth as well…
What would it take to reverse these trends? … Austerity, including sequestration, is the economic version of medieval leeching… We also need a significant, permanent program to absorb excess labor (an explicit part of the Humphrey-Hawkins law). We should consider restarting and rescaling a subsidized jobs program from the 2009 Recovery Act that, though relatively small, made jobs possible for hundreds of thousands of workers… And we have to reassess our manufacturing policy, including reducing the trade deficit…Finally, financial deregulation has become the enemy of full employment: it funnels capital to unproductive parts of the economy, and plays a key role in the “shampoo cycle” of bubble, bust, repeat. Less volatile capital markets mean fewer shocks to the job market.
Finally, that brings me to Gillian Tett, who brings to light some of the disturbing details of the current economic environment which you don’t hear a lot (anything?) about:
A few weeks ago, when I was chatting with the head of one of America’s largest food and drink companies, he made a revealing comment about data flows. Like most consumer groups, this particular company is currently spending a lot of money to monitor its customers with big data.
But it is not simply watching what they do or do not buy. These days it is increasingly scrutinising the micro-level details of pay and benefit cycles in every district in America. The reason? Before 2007, this executive said, consumer spending on food and drink was fairly stable during the month in most US cities. But since 2007, spending patterns have become extremely volatile. More and more consumers appear to be living hand-to-mouth, buying goods only when their pay checks, food stamps or benefit money arrive. And this change has not simply occurred in the poorest areas: even middle-class districts are prone to these swings. Hence the need to study local pay and benefit cycles.
“We see a pronounced difference between how people are shopping today and before the recession,” the executive explained. “Consumers are living pay check by pay check, and they tend to spend accordingly. Then you have 50 million people on food stamps and that has cycles too. So for our business it has become critical to understand the cycle – when pay [and benefit] checks are arriving.”
Perhaps the conventional wisdom that reducing the deficit is more important than increasing employment is changing. I hope so. The change can’t come soon enough.
PS Brad DeLong with a couple “monetary policy for dummies” charts:
LOLCAT SEZ: WHEN UR INFLATION BELOW AND UR UNEMPLOYMENT CONSISTENTLY ABOVE TARGET, UR DOIN IT WRONG
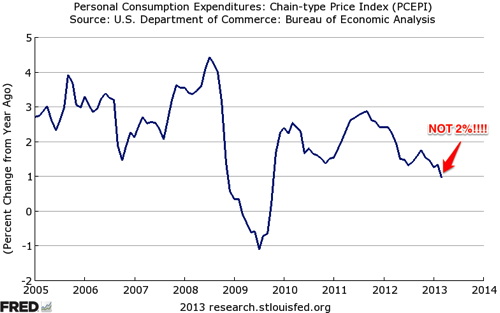
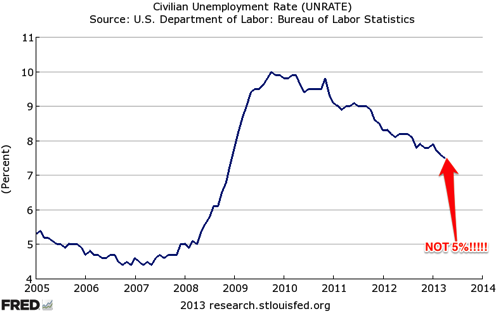
In this case, “you” is the Federal Reserve, and “it” is monetary policy.
I’d say fiscal policy is a much more powerful tool in current circumstances but – as our elected representatives steadfastly refuse to use it – do what you can with monetary policy.